Remote API debugging with VS Code
Each Zato environment ships with default configuration that lets its servers be started from a Visual Studio Code's debugger
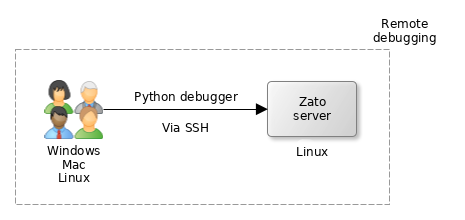
Servers started in this way can run remotely, e.g. your local IDE may be on Mac or Windows while your Zato servers will be in a remote Linux instance. This will still let you debug your services deployed remotely.
It does not matter whether the server is under Docker or if it runs in a Linux VM directly
This chapter contains step-by-step instructions on how to start a Zato server in such a manner and how to debug your code remotely from VS Code
Prerequisites
Ensure that your remote Zato server runs in a Linux system that has at least 2 CPUs and 2 GB of RAM. If you use AWS, a medium instance will be the correct one to choose.
Make sure that there is SSH connectivity between your localhost and the remote Linux server, that is, you can ssh into the system where the Zato server is. As a reminder, if you use Docker Quickstart, the default port is 22022.
If the server runs in a Docker Quickstart instance, there are no further prerequisites and you can skip to the next section
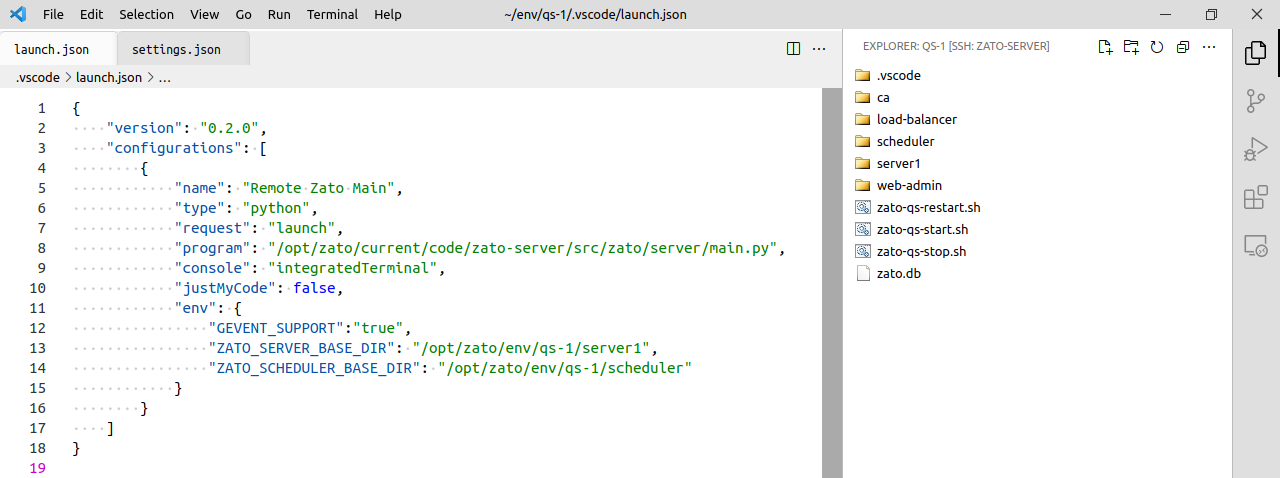
If you created a Zato cluster yourself, check if these two files exist:
If the files do not exist, download them here: launch.json and settings.json
Once downloaded, save them to the locations above; if the
.vscodedirectory does not exist, create it. The end result should be that if, for instance, your environment is in/opt/zato/env/dev, the files will go to/opt/zato/env/dev/.vscode.
SSH connections in VS Code
In VS Code, install an extension called Remote - SSH
After you install it, there will be a new button available in the bottom-left hand side corner of your IDE. The button will let you open SSH connections. Click it and then click "Connect to Host"
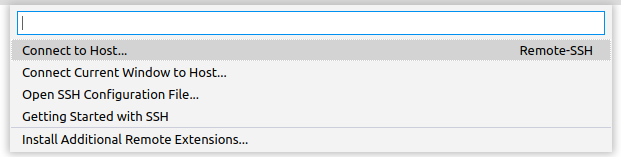
- Choose the host where your Zato server is and the IDE will open a new window to connect to that host using SSH. Make sure that you connect as remote user
zato, not as your own. Enter SSH credentials if necessary. Note that you will be in a new IDE window now.
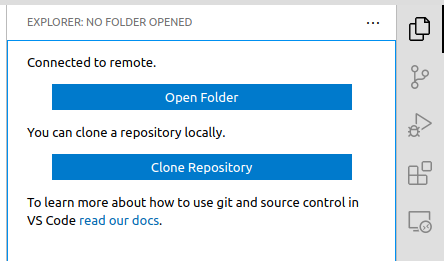
Opening a remote environment
- Once you are connected in a new window, choose "Open Folder", select the directory where your environment is and click OK
- Under Docker Quickstart, the path will be
/opt/zato/env/qs-1/. In other environments, navigate to your environment's path accordingly.
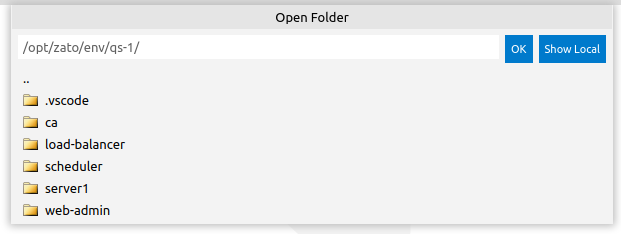
- After opening the remote directory with a Zato environment, your IDE window will look like below:
Starting the server
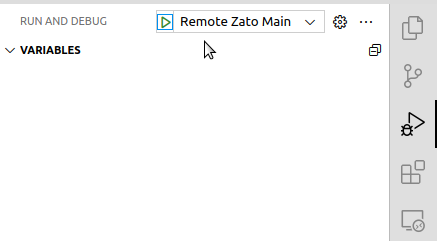
- Click the
Run and Debugicon:
![]()
- Click the play icon next to the
Remote Zato Mainoption:
The IDE will work now on installing all of its own components in the remote Linux server - that may take a couple of minutes the first time around. The process is CPU-intensive which is why 2 CPUs are a prerequisite.
If VS Code tells you that its Python IDE extension is not installed in the remote SSH system, choose to install it over SSH. This may also take a couple of minutes.
Allow for some time until the IDE completes the installation of its remote components - there will be feedback provided in the IDE window's footer. Once they are installed, proceed to the next section below.
Deploying a test service
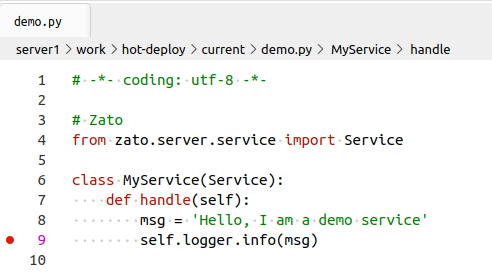
- Save the code below as
demo.pyand hot-deploy it in the now-already-started remote server. Note the highlighted line, we are going to add a breakpoint to it soon.
# -*- coding: utf-8 -*-

# Zato
from zato.server.service import Service

class MyService(Service):
    def handle(self):
        msg = 'Hello, I am a demo service'
        self.logger.info(msg)
Debugging a service
In the IDE, find the deployed service on a remote server under the path of
/path/to/server/work/hot-deploy/current/demo.pyand open it: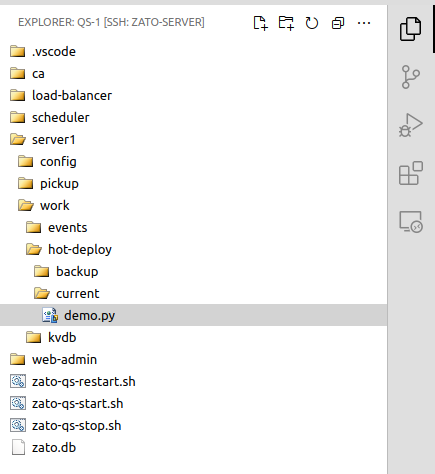
Add a breakpoint in line 9, as indicated below:
Invoke the service in any way you prefer, e.g. through REST, Dashboard or from command line
The debugger will stop at line 9, showing the local variables, the call stack and other details, exactly as if it was a local server
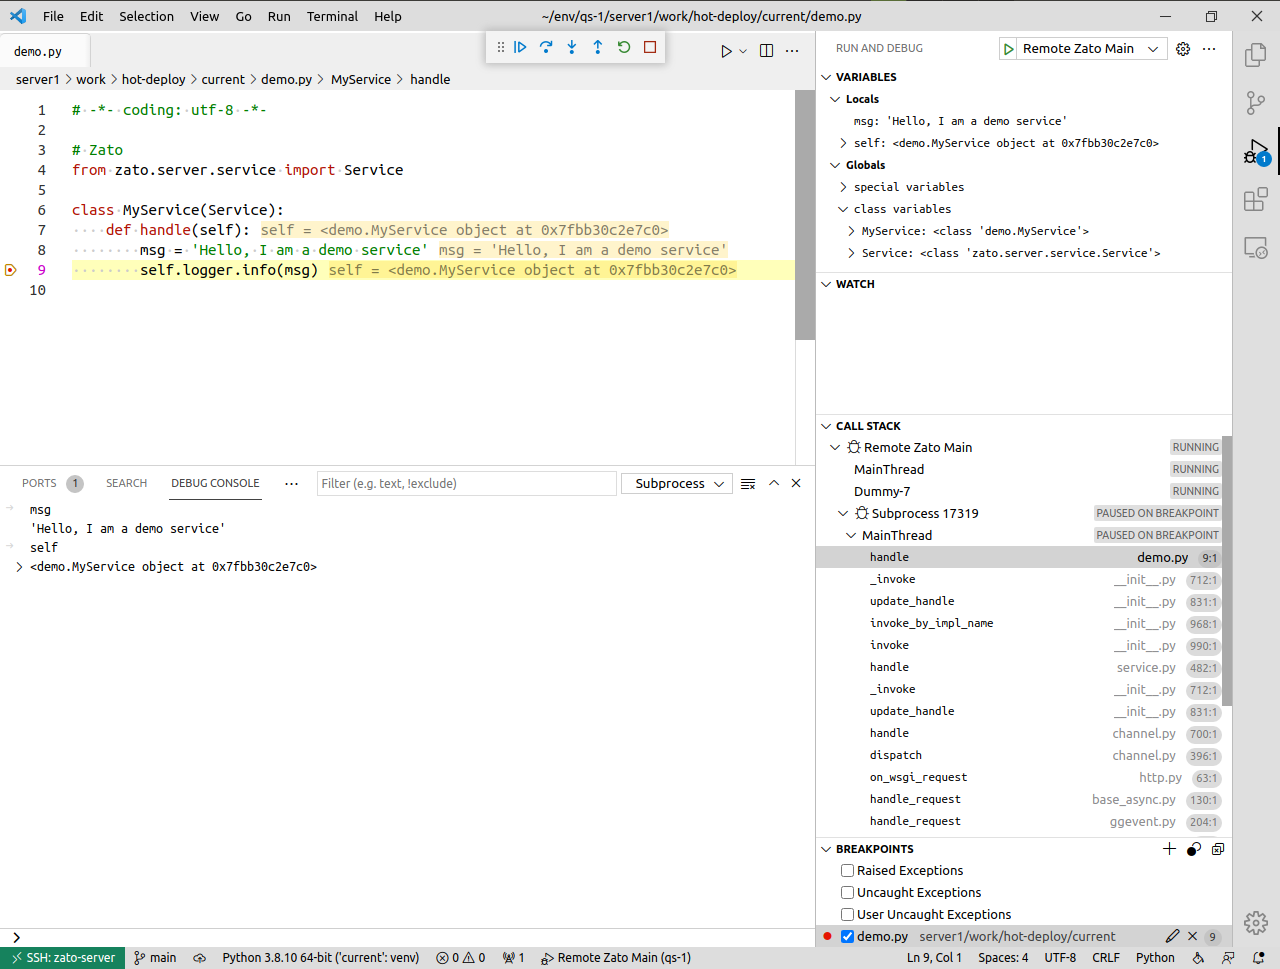
- This concludes the process, you can debug your API services remotely now
Related topics
- Configuring Visual Studio Code
- Configuring PyCharm