
 Monitoring with Prometheus
The /metrics endpoint, RED metrics, scraping configuration and PromQL queries.
Zato exposes a Prometheus /metrics endpoint with request rates, latencies, error breakdowns, service invocations, pub/sub throughput and scheduler job outcomes. Prometheus fetches the numbers every 15 seconds, stores them as time series, and you query, graph and alert on them with PromQL.
The /metrics endpoint is what Grafana and Datadog dashboards are built on.

This page connects a Prometheus-compatible scraper to Zato, verifies that metrics are flowing and builds the first queries for request rates, latencies and error breakdowns - queries you can paste into dashboards and alerts as they stand.
Checking the endpoint
The /metrics endpoint is created automatically when you start a container. It uses HTTP Basic Auth - the default username is metrics and the password is either whatever you set in Zato_Metrics_Password before creating the environment, or a random string that was generated for you.
You can always change the password in Dashboard under Security -> HTTP Basic Auth, look for the entry named metrics.
Let's verify that the endpoint is working. Open a terminal and run:
You should see output like this:
# HELP zato_rest_channel_requests_total Total REST channel requests ...
# TYPE zato_rest_channel_requests_total counter
zato_rest_channel_requests_total{channel_name="crm.api",status_code="2xx",error_source="none"} 53.0

# HELP zato_rest_channel_request_duration_seconds Duration of REST channel requests ...
# TYPE zato_rest_channel_request_duration_seconds histogram
zato_rest_channel_request_duration_seconds_bucket{channel_name="crm.api",le="0.005"} 19.0
...
Notice a few things about the output:
- Every metric starts with
zato_- that's the prefix for all Zato metrics - Durations are in seconds (
_seconds), not milliseconds - Sizes are in bytes (
_bytes) - Counters end with
_total
If you get a 401, the password is wrong - go to Security -> HTTP Basic Auth in Dashboard and update it.
Connecting Prometheus to Zato
In the middle is Prometheus, which pulls metrics from Zato's /metrics endpoint every 15 seconds, stores them as time series, and makes them available via a query language called PromQL.
Prometheus itself comes with a basic query interface where you can type queries and see simple graphs. For rich dashboards and alert routing, connect a dashboarding tool to Prometheus - Grafana and Datadog both support PromQL, so the queries on this page work in either of them, and their pages describe the setup of each step by step.
To point a scraper at the endpoint, add this to your prometheus.yml:
scrape_configs:
  - job_name: zato
    scrape_interval: 15s
    metrics_path: /metrics
    basic_auth:
      username: metrics
      password: your-password
    static_configs:
      - targets:
          - zato-server:11223
After the first scrape has completed (i.e. after 15 seconds), confirm that data is arriving as expected. Open your Prometheus UI (e.g. http://localhost:9090) and run:
You should see something like the below (up{instance="localhost:11223",job="zato"}) which will confirm that you connected Prometheus correctly to Zato.
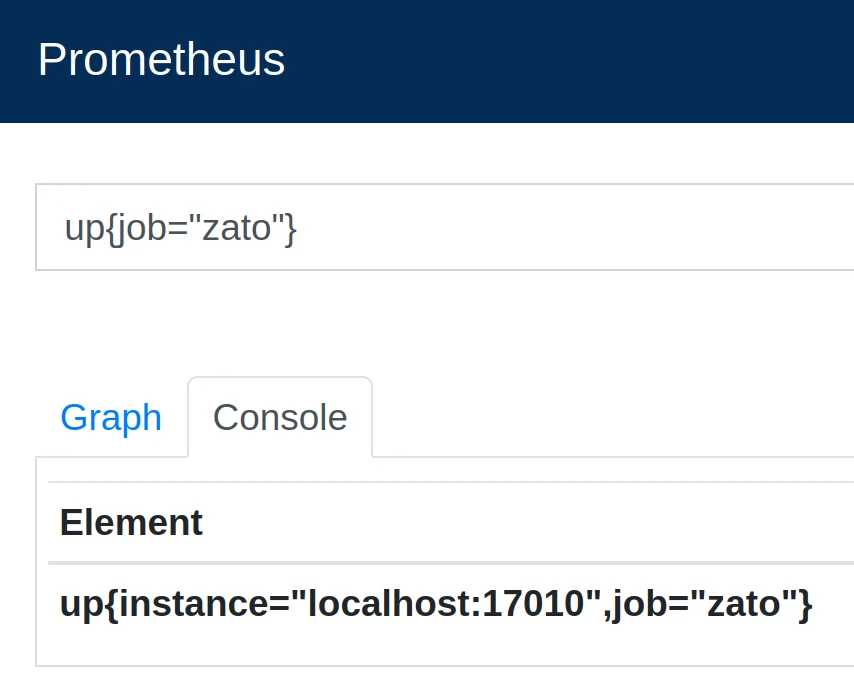
A scrape that times out points at connectivity first - a wrong host or port, a firewall, or the process not listening where you think it is. Under normal load a Zato scrape completes in under 100 ms, so if connectivity checks out, increase scrape_timeout in your scraper config to at least 5 seconds.
Request rates, errors and latency
How much traffic is each REST channel handling?
What does it show? Requests per second for each channel, averaged over 5 minutes. Channel names come from what you configured in Dashboard.
What fraction of requests are errors?
sum by (channel_name) (rate(zato_rest_channel_requests_total{status_code=~"4xx|5xx"}[5m]))
  /
sum by (channel_name) (rate(zato_rest_channel_requests_total[5m]))
The status_code label uses classes like 2xx and 5xx rather than raw codes like 200 or 503. This keeps the number of time series low and makes queries simpler.
The error_source label
A failed request is either a failure of your Zato service or of one of the external systems it talks to. Those external systems - CRM, billing, payment gateways, any API your service calls - are called upstreams.
Every request counter has an error_source label that says which side failed, directly in PromQL, without correlating logs:
| Value | When it is set |
|---|---|
none | The request succeeded (2xx, 3xx) |
gateway | Zato returned the error - a service exception, validation failure, or misconfiguration |
upstream | An external system your service calls failed - timeout, connection refused, DNS failure |
auth | Authentication or authorization denied the request |
rate_limit | Rate limiting rejected the request |
Services, pub/sub and the scheduler

Setting up an SLO alert
An SLO (Service Level Objective) is a target you set for how reliable your service should be - for example, "99.9% of requests should succeed over a rolling 30-day window". The 0.1% that is allowed to fail is your error budget. A burn-rate alert fires when that budget is being consumed faster than expected, catching both sudden spikes and sustained degradation before you run out:
(
  sum(rate(zato_rest_channel_requests_total{status_code=~"5xx"}[1h]))
    / sum(rate(zato_rest_channel_requests_total[1h]))
  > (14.4 * 0.001)
)
and
(
  sum(rate(zato_rest_channel_requests_total{status_code=~"5xx"}[5m]))
    / sum(rate(zato_rest_channel_requests_total[5m]))
  > (14.4 * 0.001)
)
This fires when the 5xx rate exceeds 1.44% in both the 1-hour and 5-minute windows simultaneously. Requiring both windows to breach at the same time avoids alert fatigue from brief spikes that resolve on their own.
Cardinality and histogram buckets
In Prometheus, every unique combination of a metric name and its label values creates a separate time series. For example, if you have 10 channels and 5 status code classes, that's 50 time series just for zato_rest_channel_requests_total. When the number of time series grows too large - typically because a label has too many possible values - Prometheus uses more memory and queries slow down. This is known as a cardinality problem.
All Zato labels come from configuration objects you define in Dashboard - channel names, service names, connection names, topic names, job names. No label is ever derived from unbounded request data like URL paths, query strings, user IDs, or IP addresses.
For a deployment with 50 REST channels, 20 outgoing connections, 100 services, 10 pub/sub topics, and 20 scheduler jobs, the total comes to around 6,400 time series. Even if your deployment is larger, the number grows linearly with the number of configured objects, not with traffic volume.
All duration histograms use 12 buckets from 5 ms to 30 seconds:
All size histograms use 10 buckets from 64 bytes to 16 MB:
Each set is shared by every histogram of its type - duration or size - so aggregating across channels or connections in PromQL works correctly.
Metric reference
For a complete reference of every metric Zato exposes - including type, labels, bucket values, and example queries - see Prometheus metric reference.