Zato's integration with Datadog APM (Application Performance Monitoring) gives you end-to-end observability across your entire API platform through distributed tracing.
Every request flowing through Zato - from REST channels, through services, to outgoing API connections - is automatically traced and correlated. Combined with custom metrics and log correlation, you get a complete picture of how your integrations behave - from development, through testing, to production.
To configure the integration, you need one prerequisite:
To configure the integration:
Monitoring → Datadog in your Zato dashboardhttp://localhost:8126)http://localhost:8125)Note that you don't need to provide your agent's API key to Zato. Your agent will use it to communicate with Datadog, but itself, it doesn't use it.
Before saving, click Test connection to verify that Zato can reach your Datadog agent with the provided configuration.
If the test fails, common issues include:
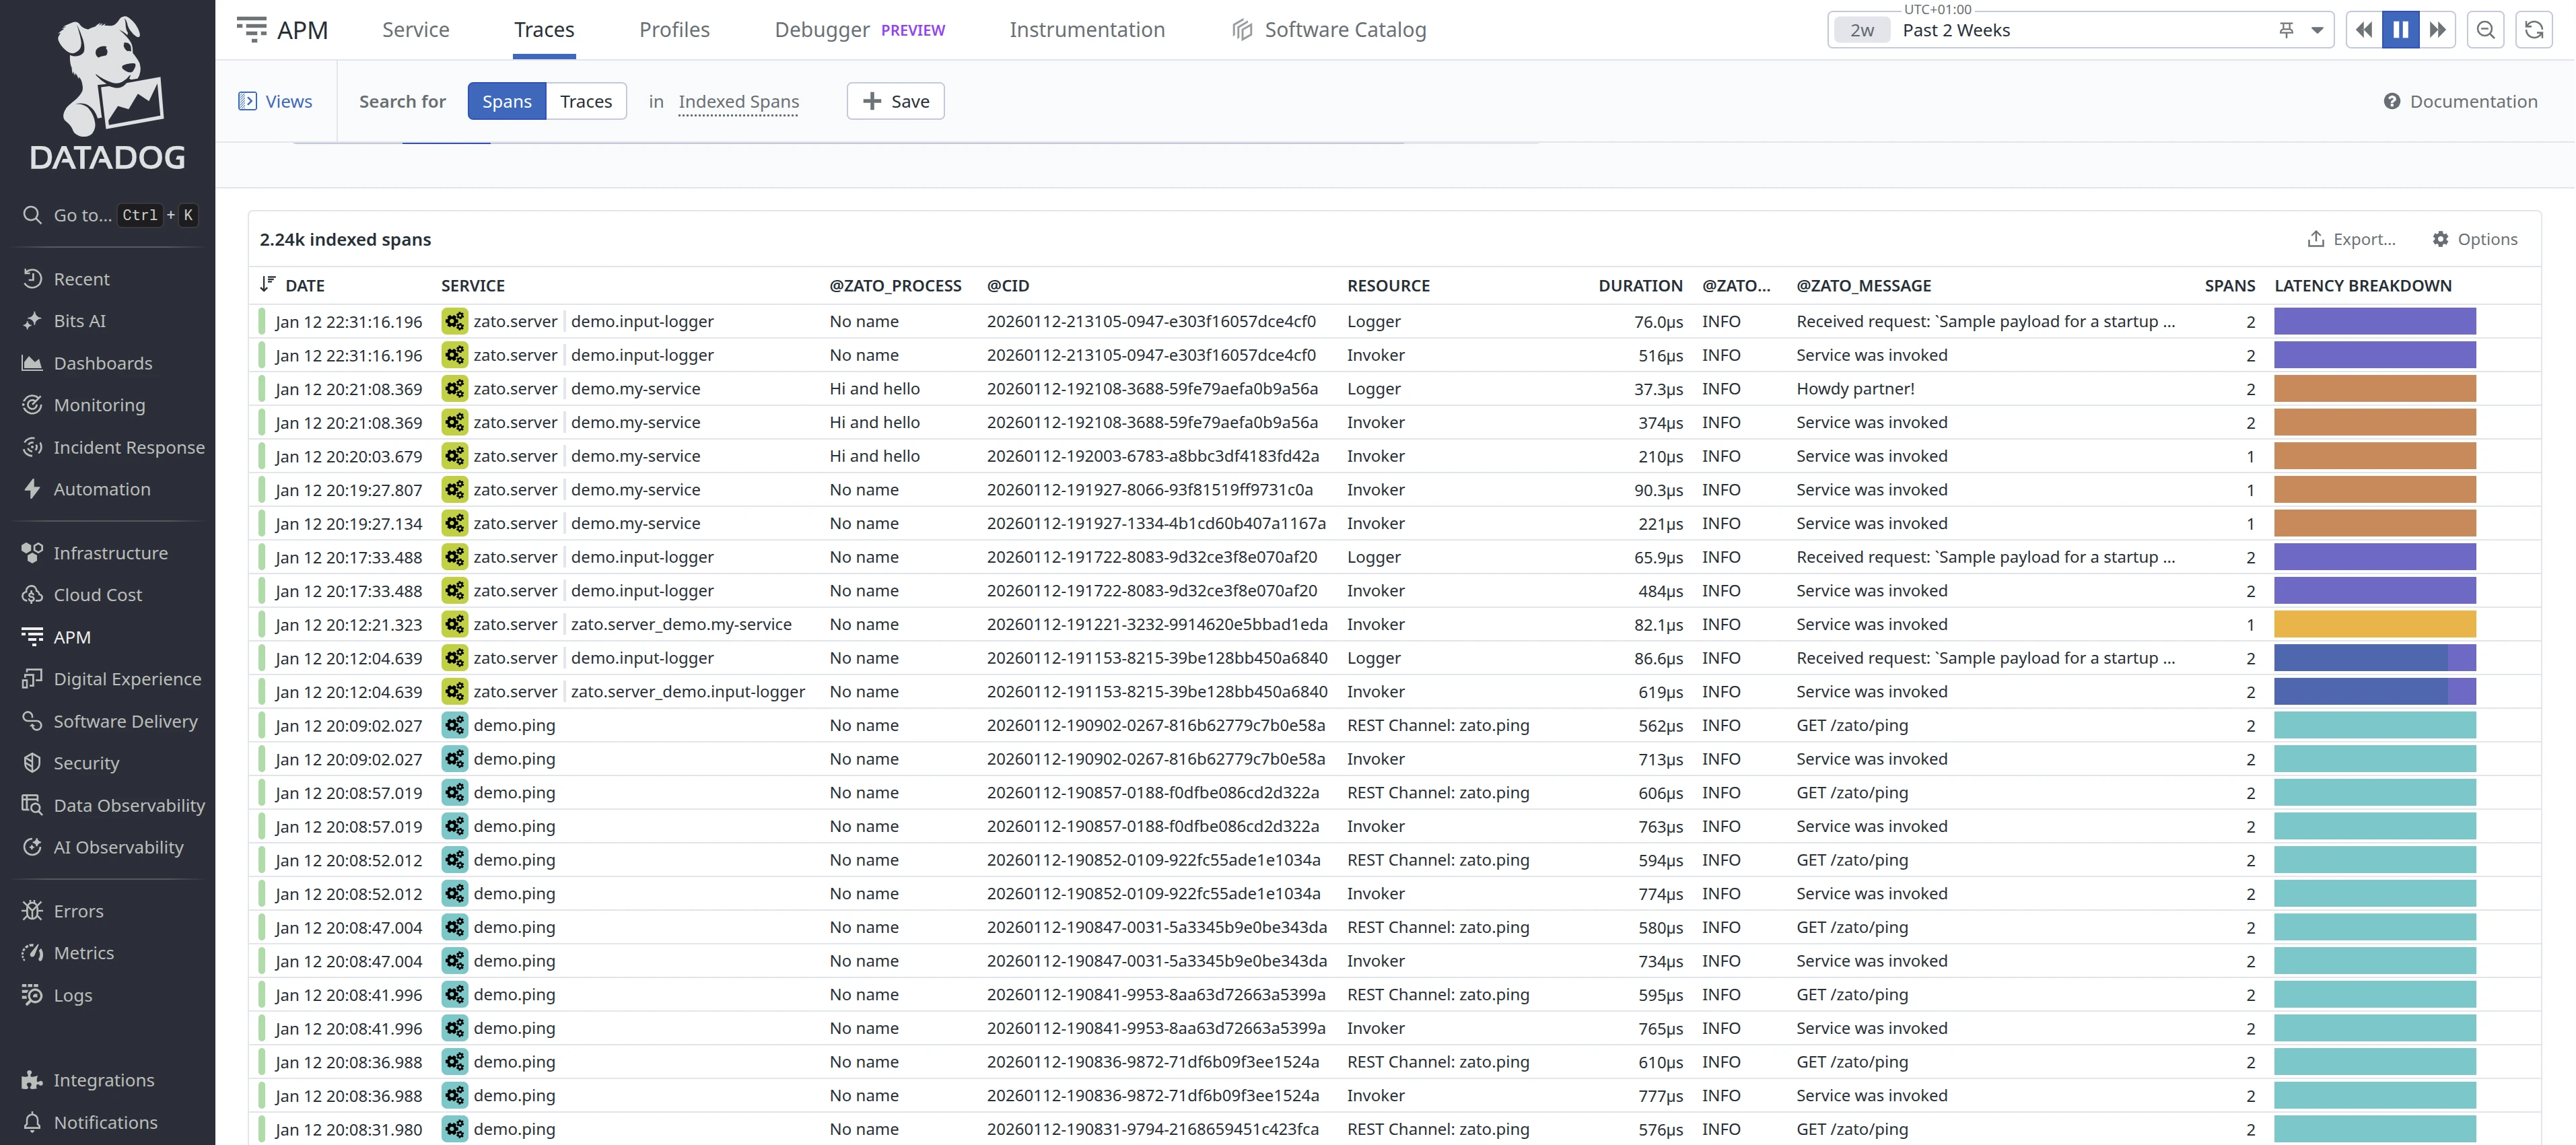
Zato automatically creates trace entries (called spans by Datadog) for the full request path - from incoming REST channels, through service invocations, to outgoing REST connections.
This happens without any code changes on your part and gives you complete visibility into how requests flow through your system.
A typical trace shows:
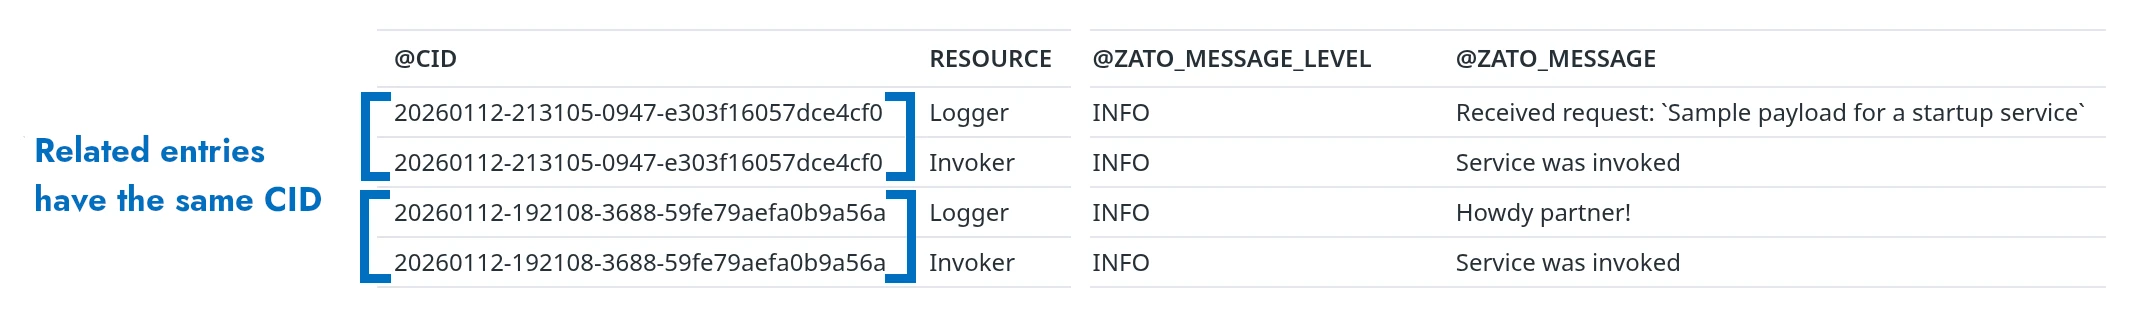
All spans in a trace share the same correlation ID (CID), so you can see the complete picture of a request from entry to exit.
To find your traces:
Each span includes:
To provide a process name for your traces, assign a process_name attribute to your services, as below. If you don't assign any, it will be called "No name".
# -*- coding: utf-8 -*-

# Zato
from zato.server.service import Service

class MyService(Service):

    # This is how you assign a process name
    process_name = 'My process'
Every trace span is tagged with zato_service, zato_process and zato_env_name attributes. You can use these to filter and query traces in Datadog APM.
In the APM Traces view, use facet filters:
@zato_service:demo.ping@zato_process:"My Process"@zato_env_name:Production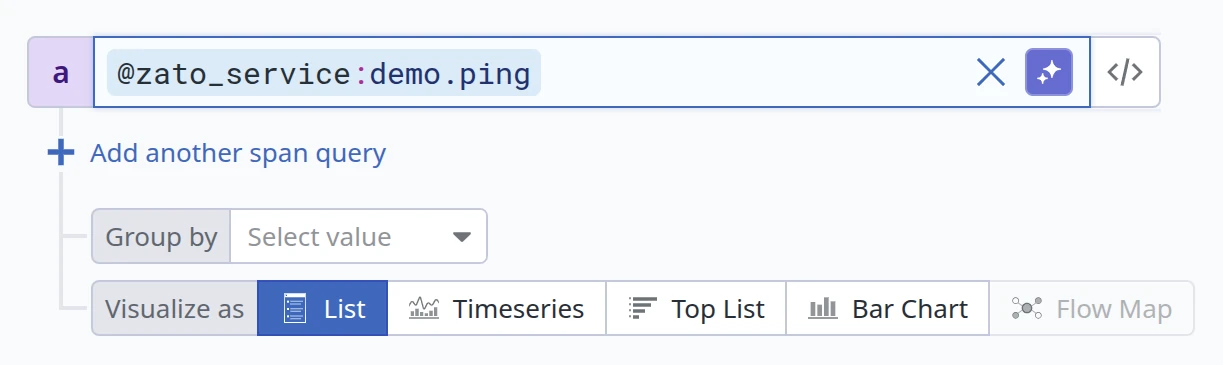
In Datadog Query Language:
This lets you isolate traces for specific services or logical process contexts across your entire Zato environment.
When Datadog monitoring is enabled, service loggers (self.logger) are automatically connected with your agent, which means that your log entries are correlated with traces in Datadog.
For instance:
# -*- coding: utf-8 -*-

# Zato
from zato.server.service import Service

class MyService(Service):

    process_name = 'My process'

    def handle(self):

        # Indicate what we're about to do ..
        self.logger.info('Processing request')

        # .. the business logic goes here ..

        # .. store information that we're done.
        self.logger.info('Request processed successfully')
The above will store logs in Datadog, and they will have the same correlation ID as other entries from the same flow of messages triggered by a given REST channel.
Use self.metrics.push to send custom metrics from your services to Datadog. This lets you track business-level indicators alongside system metrics.
Your services have access to two metrics methods:
self.metrics.push(name, value) - Sets a gauge metric to a specific value. Use this for values that can go up or down, like queue depths, temperatures, or percentages.
self.metrics.incr(name, value=1) - Increments a counter metric. Use this for values that only increase, like total requests processed or errors encountered.
# -*- coding: utf-8 -*-

# Zato
from zato.server.service import Service

class FlightBoardingStatus(Service):

    def handle(self):

        # Get boarding data from the request
        passengers_boarded = self.request.payload['passengers_boarded']
        passengers_total = self.request.payload['passengers_total']

        # Calculate boarding percentage
        boarding_percentage = (passengers_boarded / passengers_total) * 100

        # Push metrics to Datadog
        self.metrics.push('airport.flight.passengers_boarded', passengers_boarded)
        self.metrics.push('airport.flight.boarding_percentage', boarding_percentage)

        # Continue with business logic
        self.response.payload = {'status': 'ok', 'boarding_percentage': boarding_percentage}
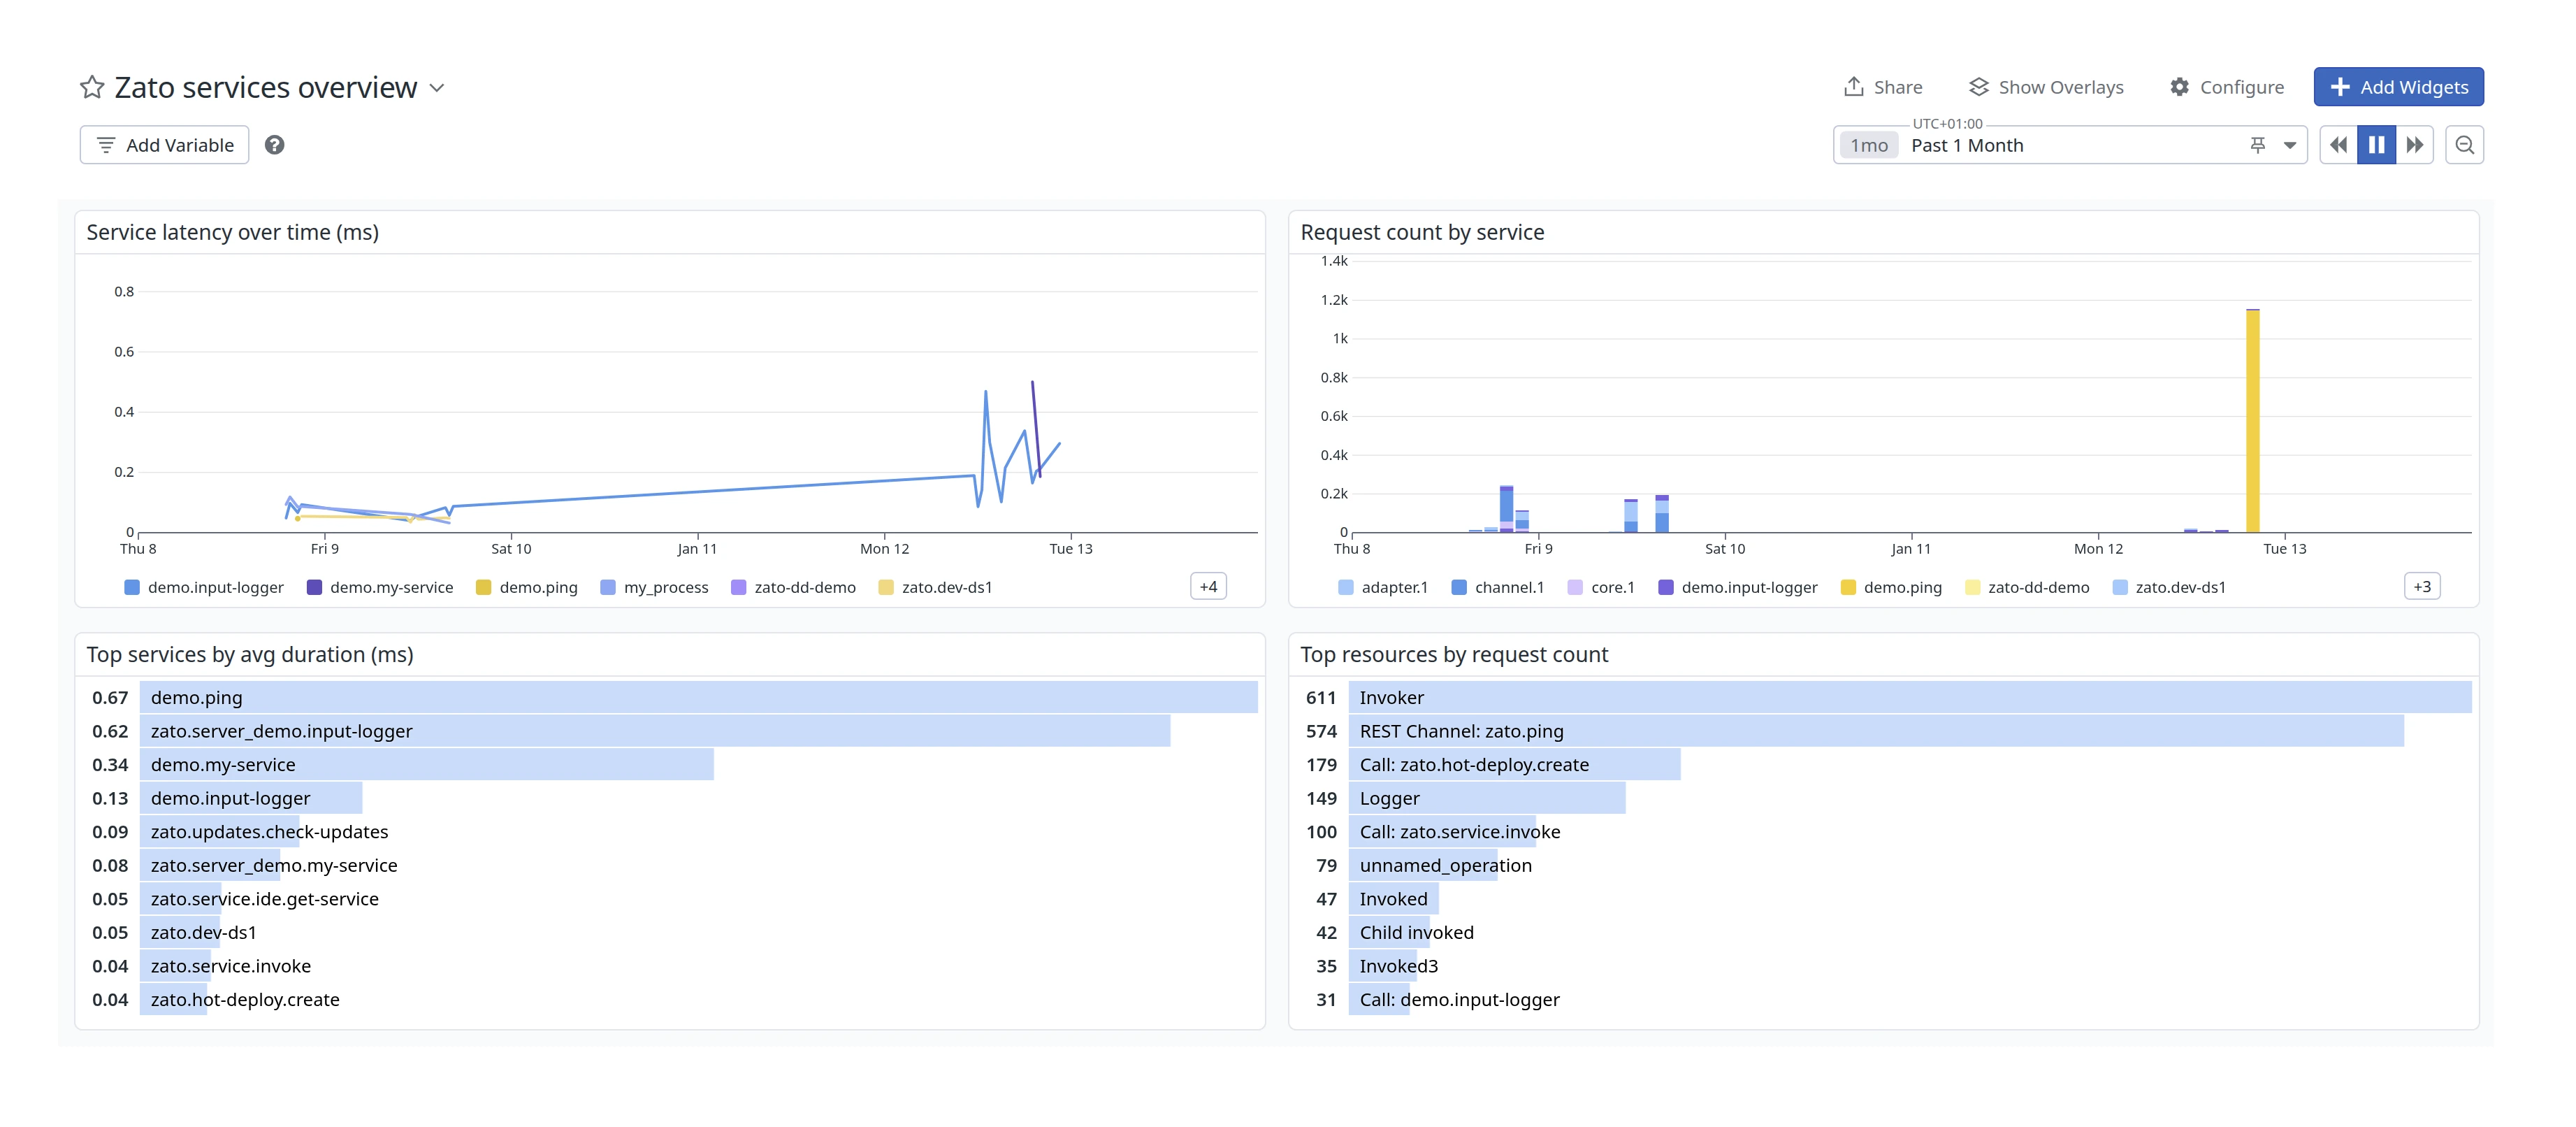
Since datadog automatically collects APM events from every traced request, you can build dashboards directly from this data by choosing APM Metrics as the data source for the dashboards.
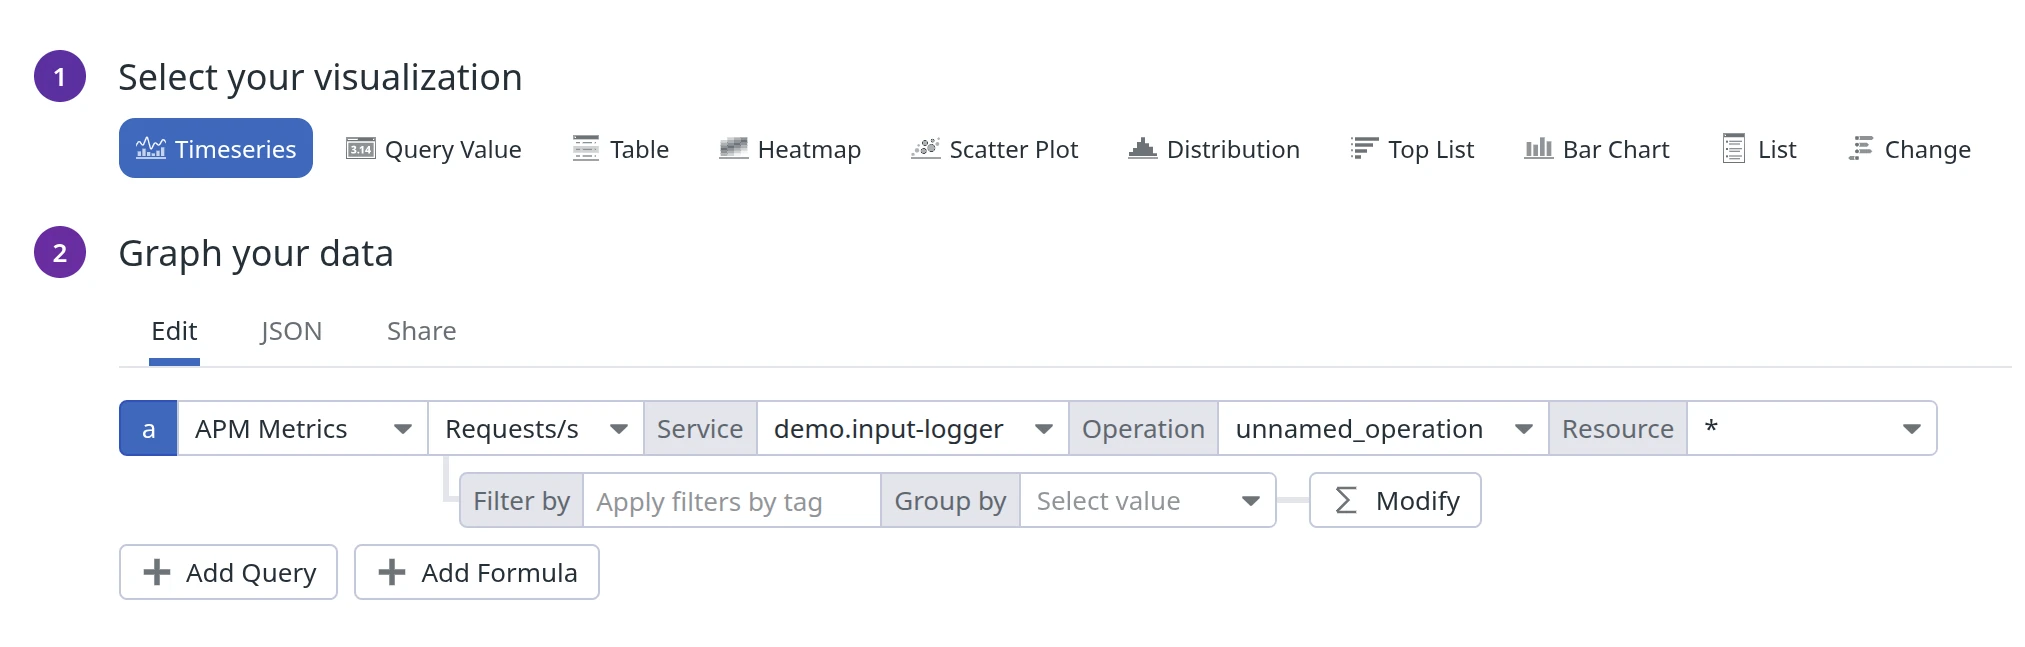
For instance, here is complete JSON that you can import to build a dashboard as below (Graph your data → JSON):
Custom metrics work for any scenario where you need real-time visibility into business operations.
For instance:
In cybersecurity, services integrating with intrusion detection systems can track firewall rule triggers, malware detection counts, quarantined endpoints, and suspicious login patterns - enabling SOC teams to correlate security events with system behavior.
In telecommunications, services handling CDR (call detail records) processing can report call setup times, routing failures, trunk utilization rates, and handover success rates - allowing network engineers to identify degradation before it impacts subscribers.
In addition to the native APM integration described above, you can also configure Datadog to parse Zato server log files directly.
Inside your container, there's a file called /opt/zato/env/qs-1/server1/logs/server.log which contains all the server logs. This file keeps the details of what's going on in your servers and it can be pushed to Datadog in order to create additional operational dashboards with insights about the state of your environments.
To automatically configure Datadog when your container starts, use environment variables:
docker run -it \
  -e Zato_Datadog_Main_Agent=http://datadog-agent:8126 \
  -e Zato_Datadog_Metrics_Agent=http://datadog-agent:8125 \
  -e Zato_Env_Name=Production \
  zatosource/zato-4.1
Environment variables take precedence over dashboard configuration. This is useful for: