Zato integrates with Grafana Cloud to let you track the health of your APIs and integrations in real-time.
You can monitor system resources, push custom metrics from your services, and build dashboards to visualize performance trends. You can also set up alerts on the metrics that matter to you, so you know about issues before they become problems.
To configure the integration, you need:
metrics:write permissionsTo obtain these credentials:
metrics:write permissions (which should be among the default ones already)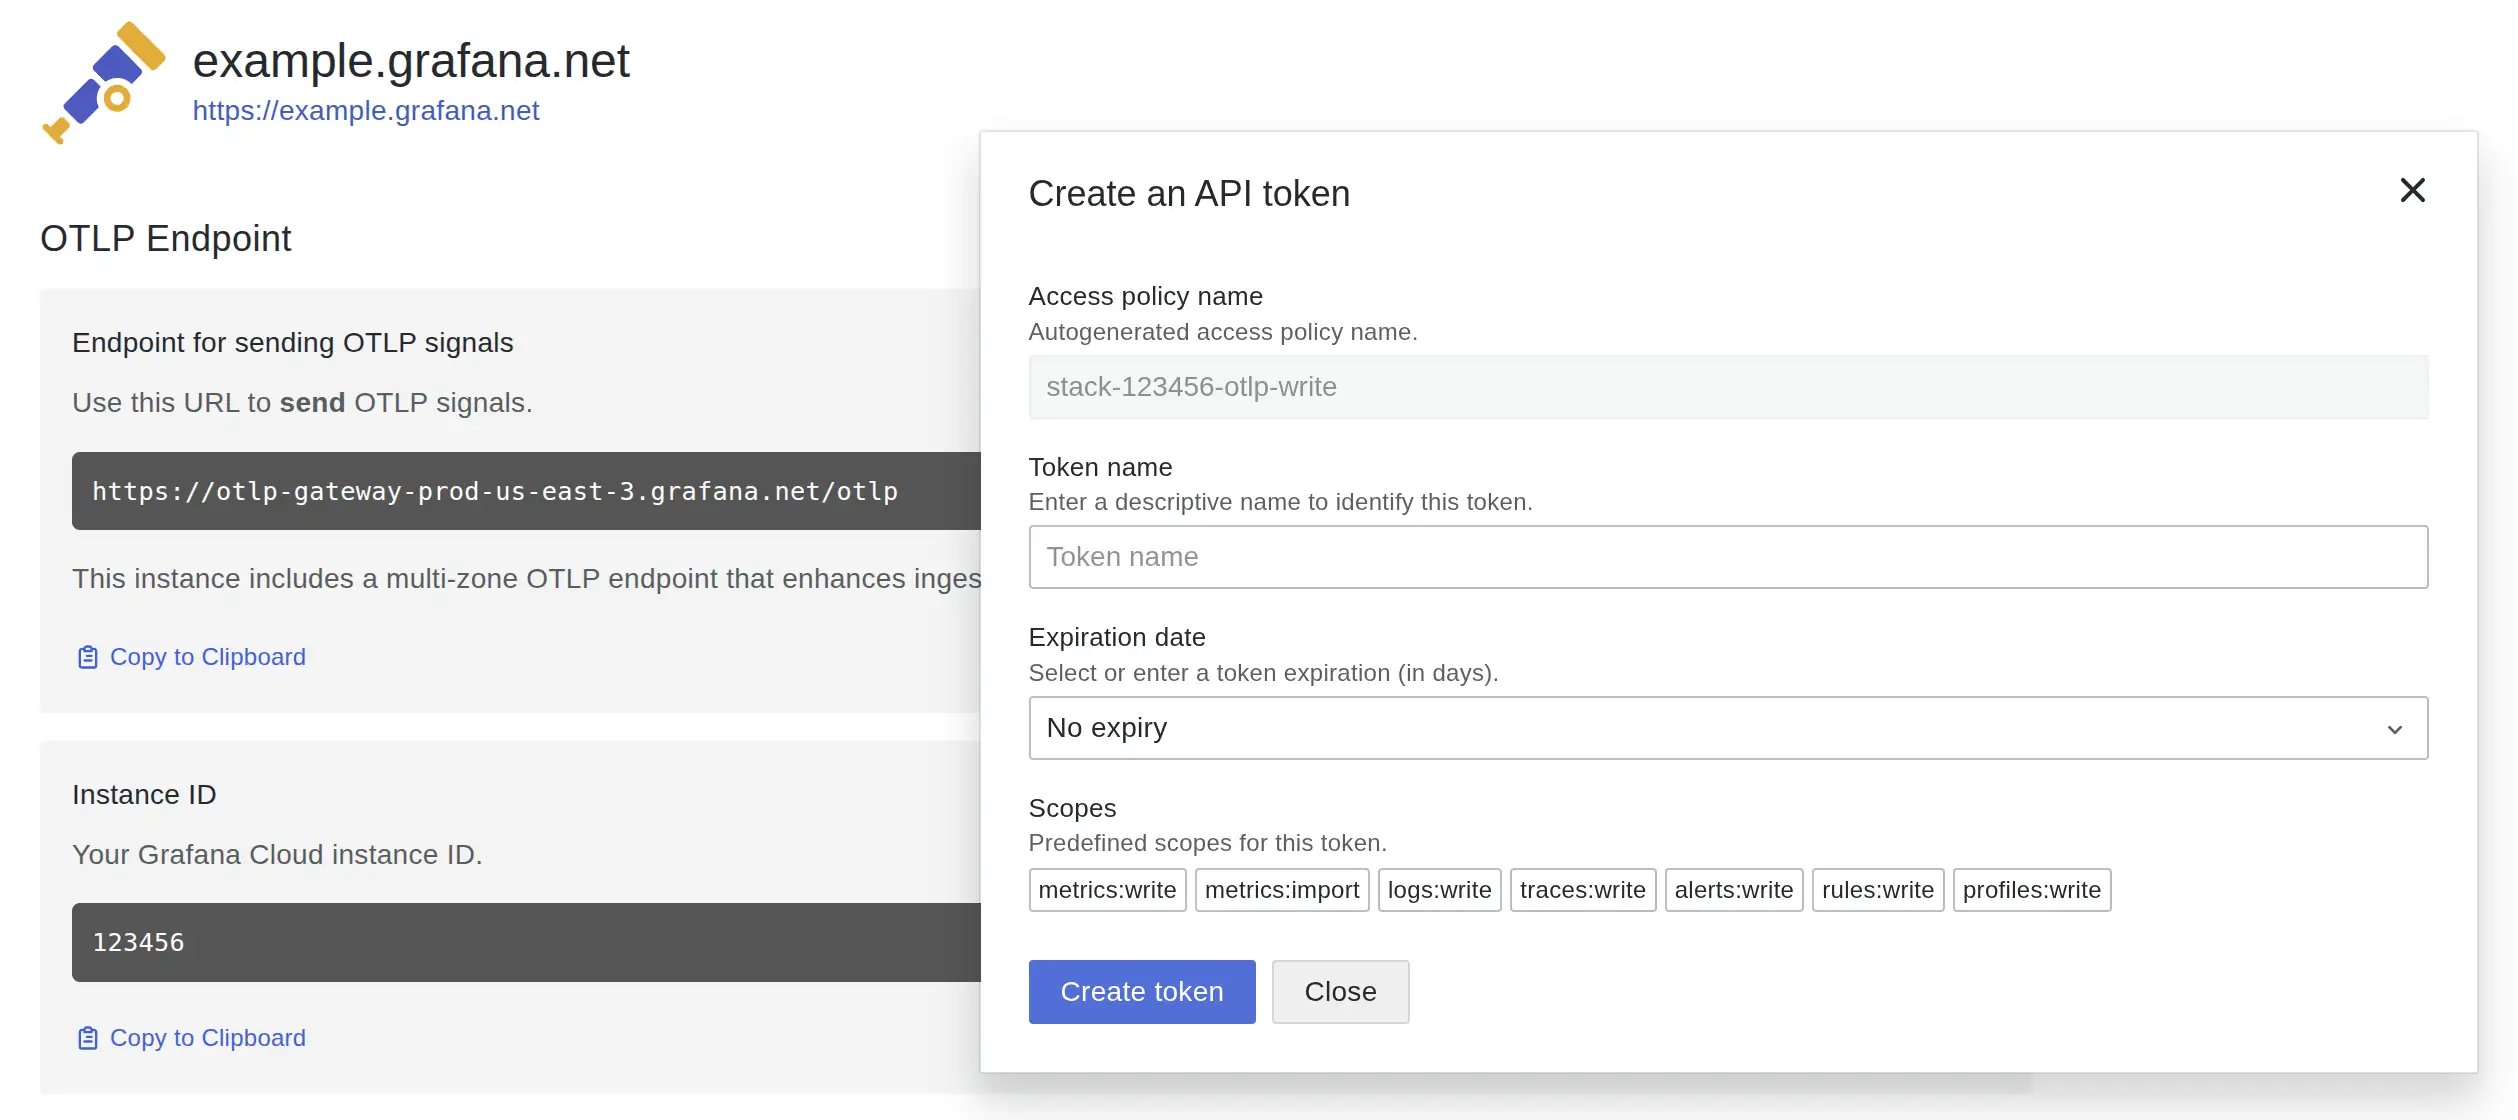
To configure the integration:
Monitoring → Grafana Cloud in your Zato dashboardhttps://otlp-gateway-prod-us-central-0.grafana.net/otlp)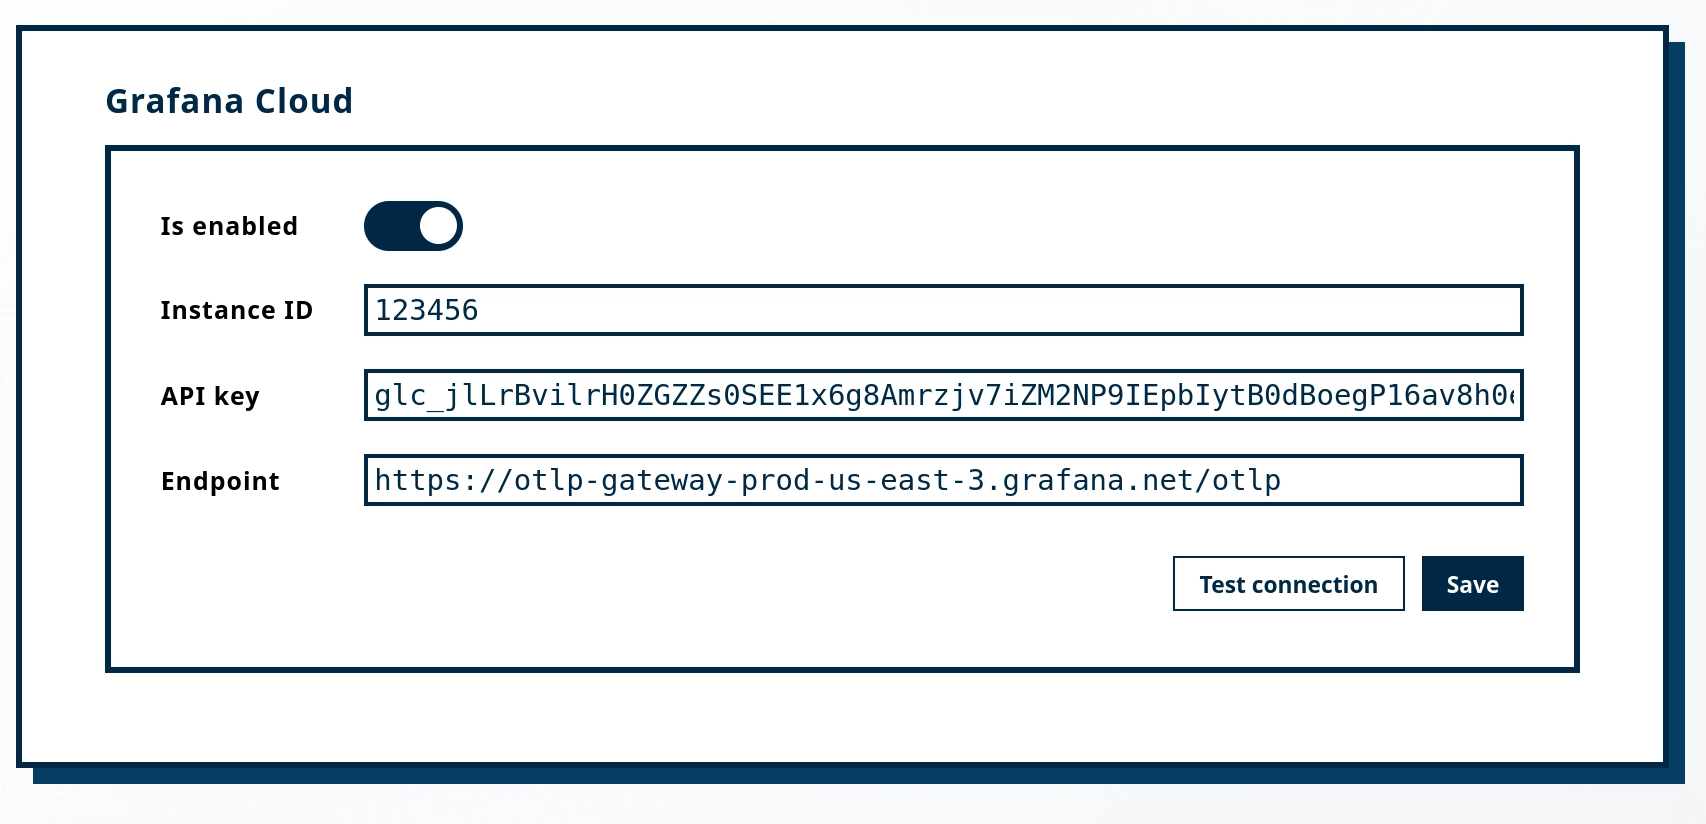
Before saving, click Test connection to verify that Zato can reach your Grafana Cloud endpoint with the provided credentials.

If the test fails, you will see the error message returned by Grafana Cloud. Common issues include:
Every time a service is invoked, Zato automatically increments a counter metric in Grafana Cloud. This happens without any code changes on your part.
Service metrics use the naming pattern zato_service_<service_name>_total where dots and hyphens in the service name are replaced with underscores. The _total suffix is added automatically by Grafana.
For example, a service named demo.ping will appear in Grafana Cloud as zato_service_demo_ping_total.
To find your service metrics:
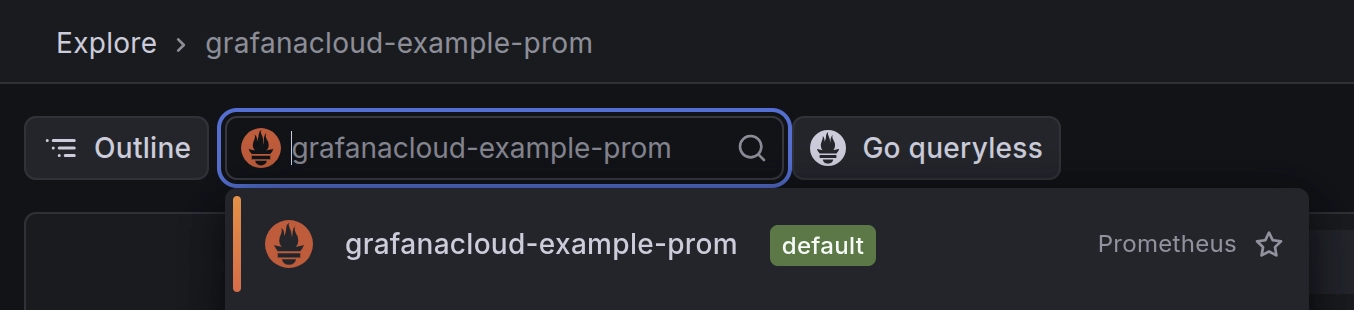
zato_service_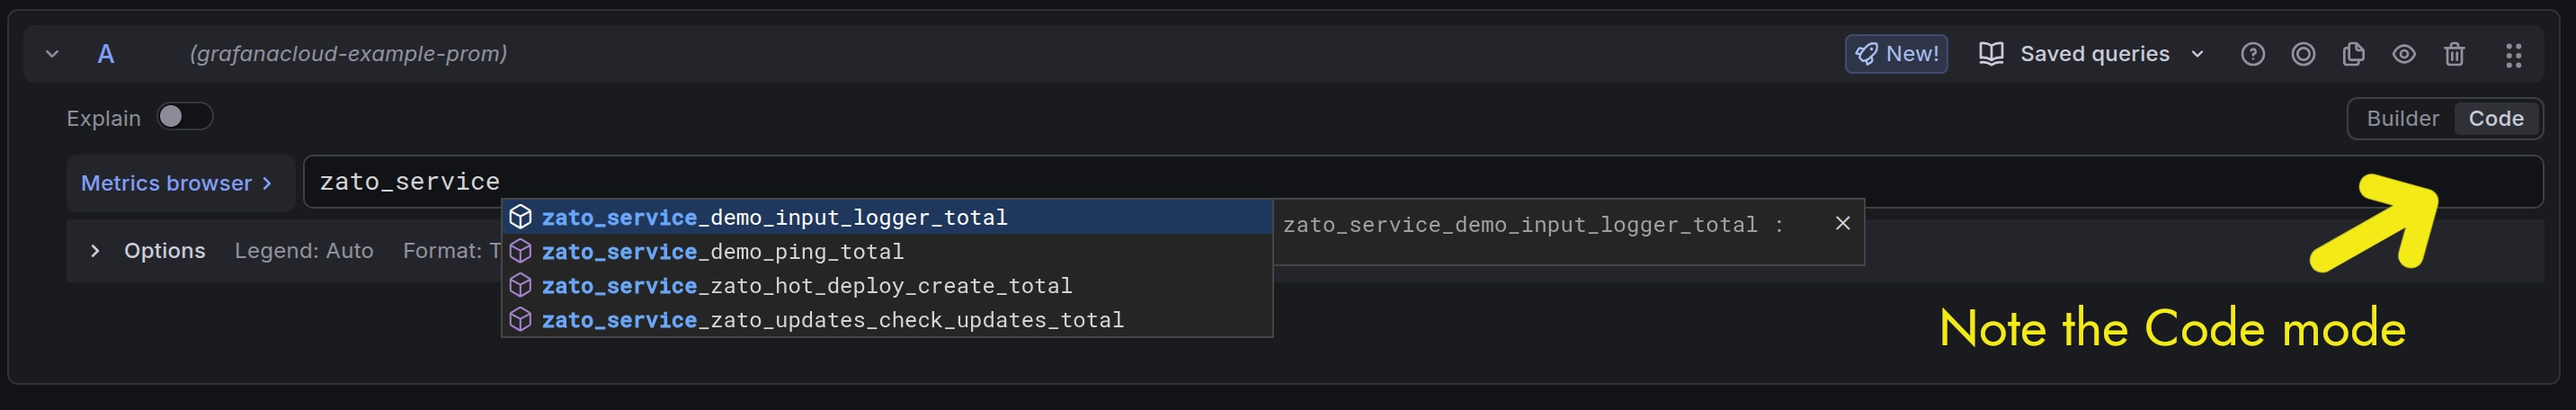
rate() function to calculate requests per second:This shows requests per second averaged over 1 minute. Adjust the interval as needed ([5m], [30s], etc.).
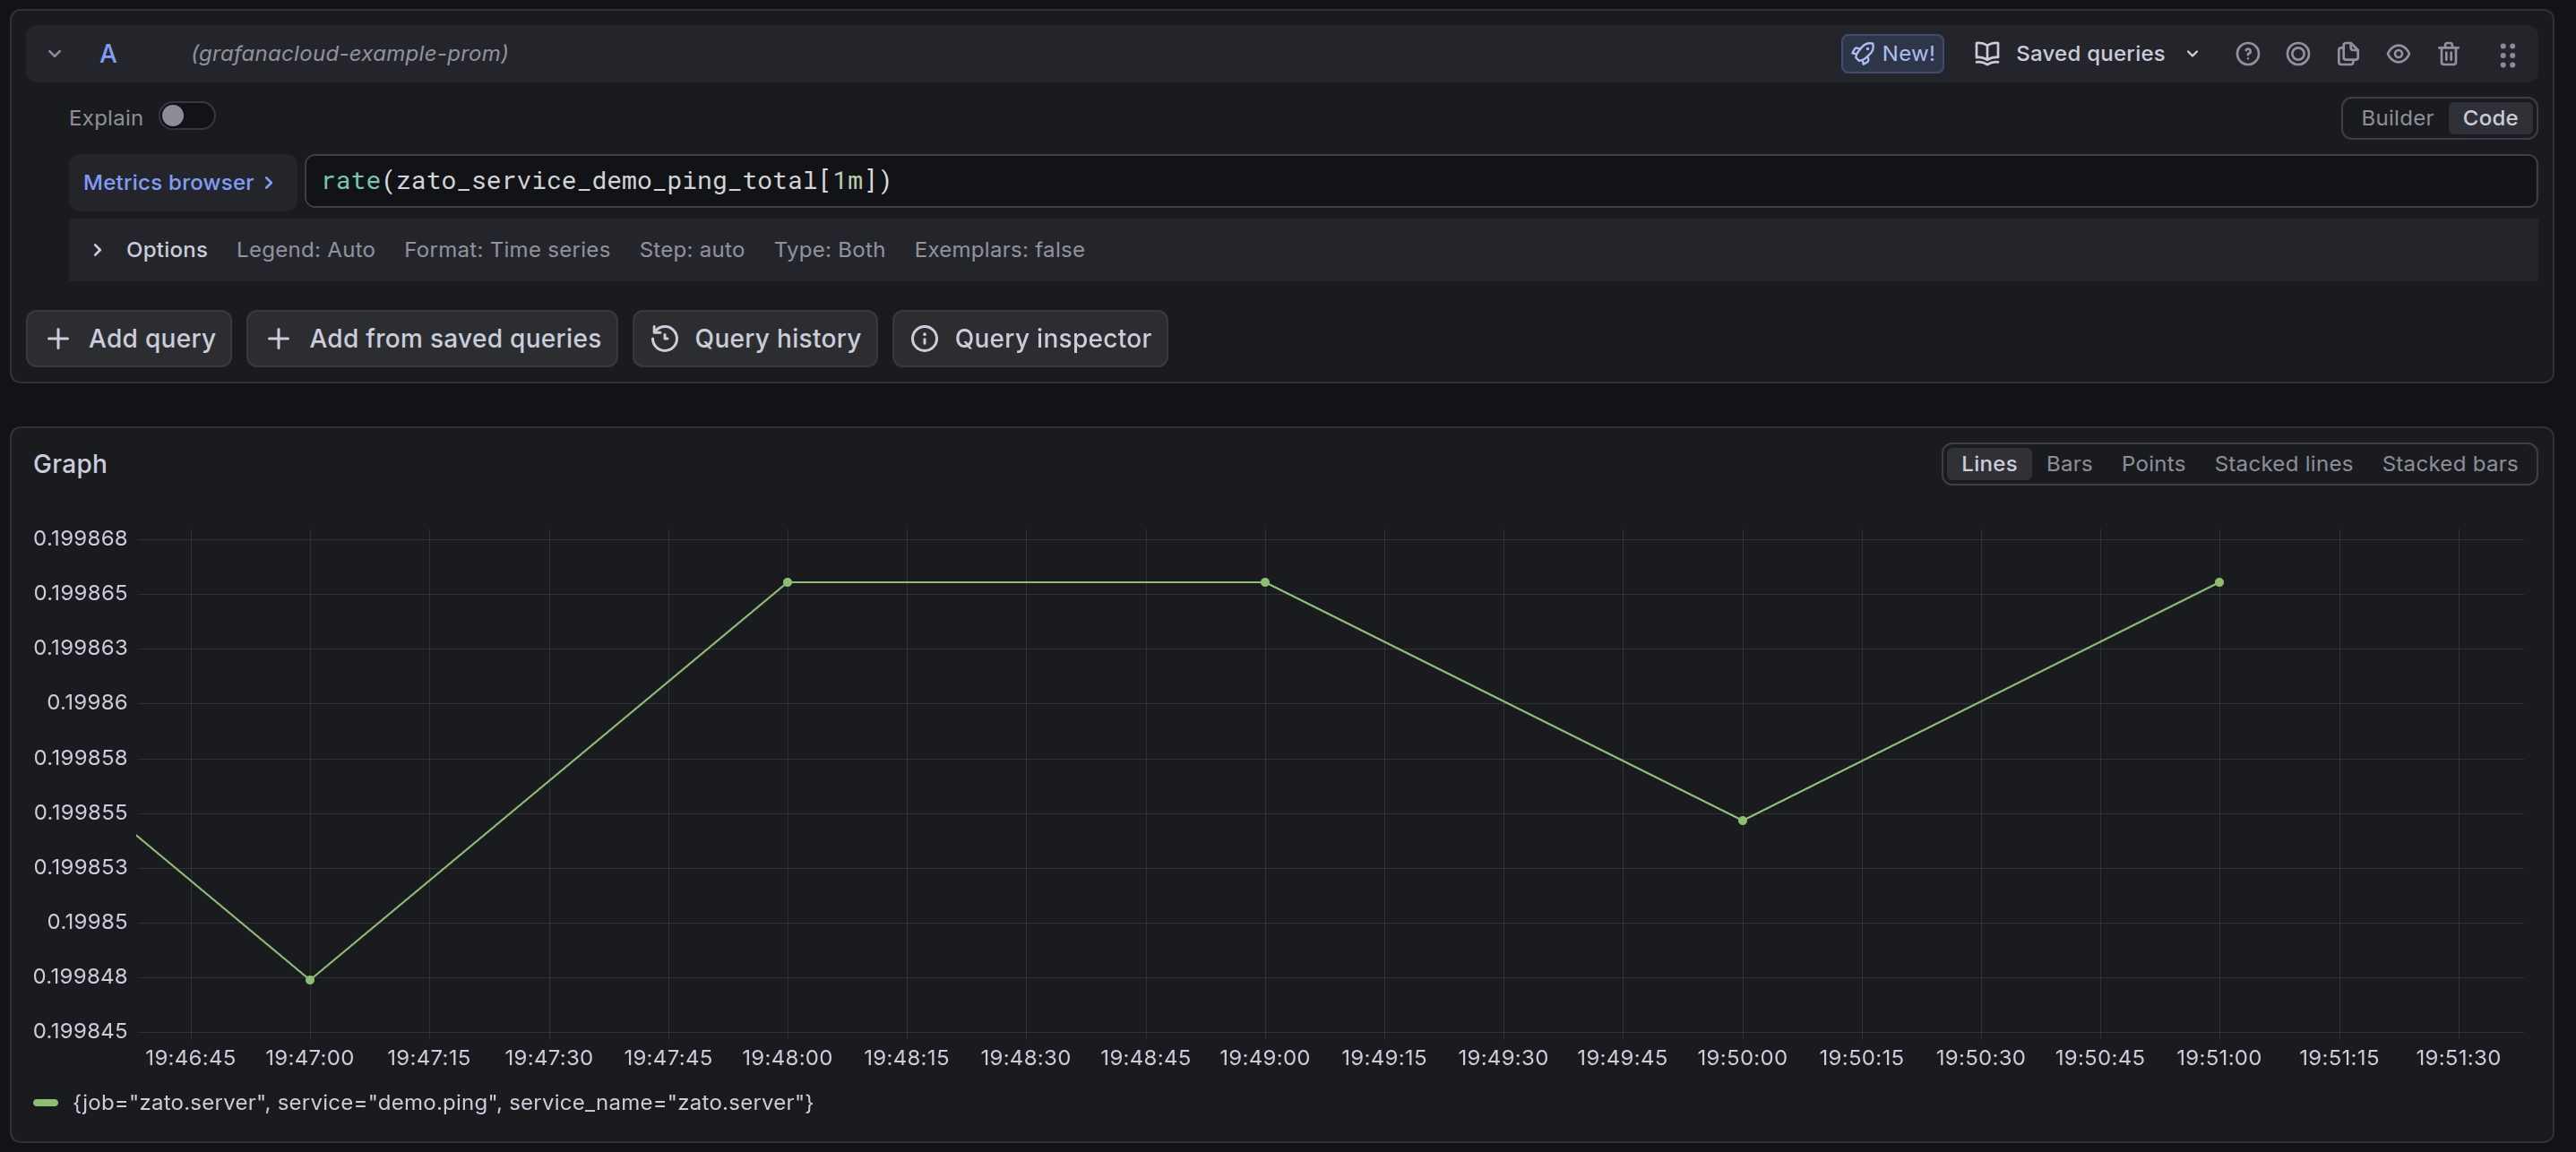
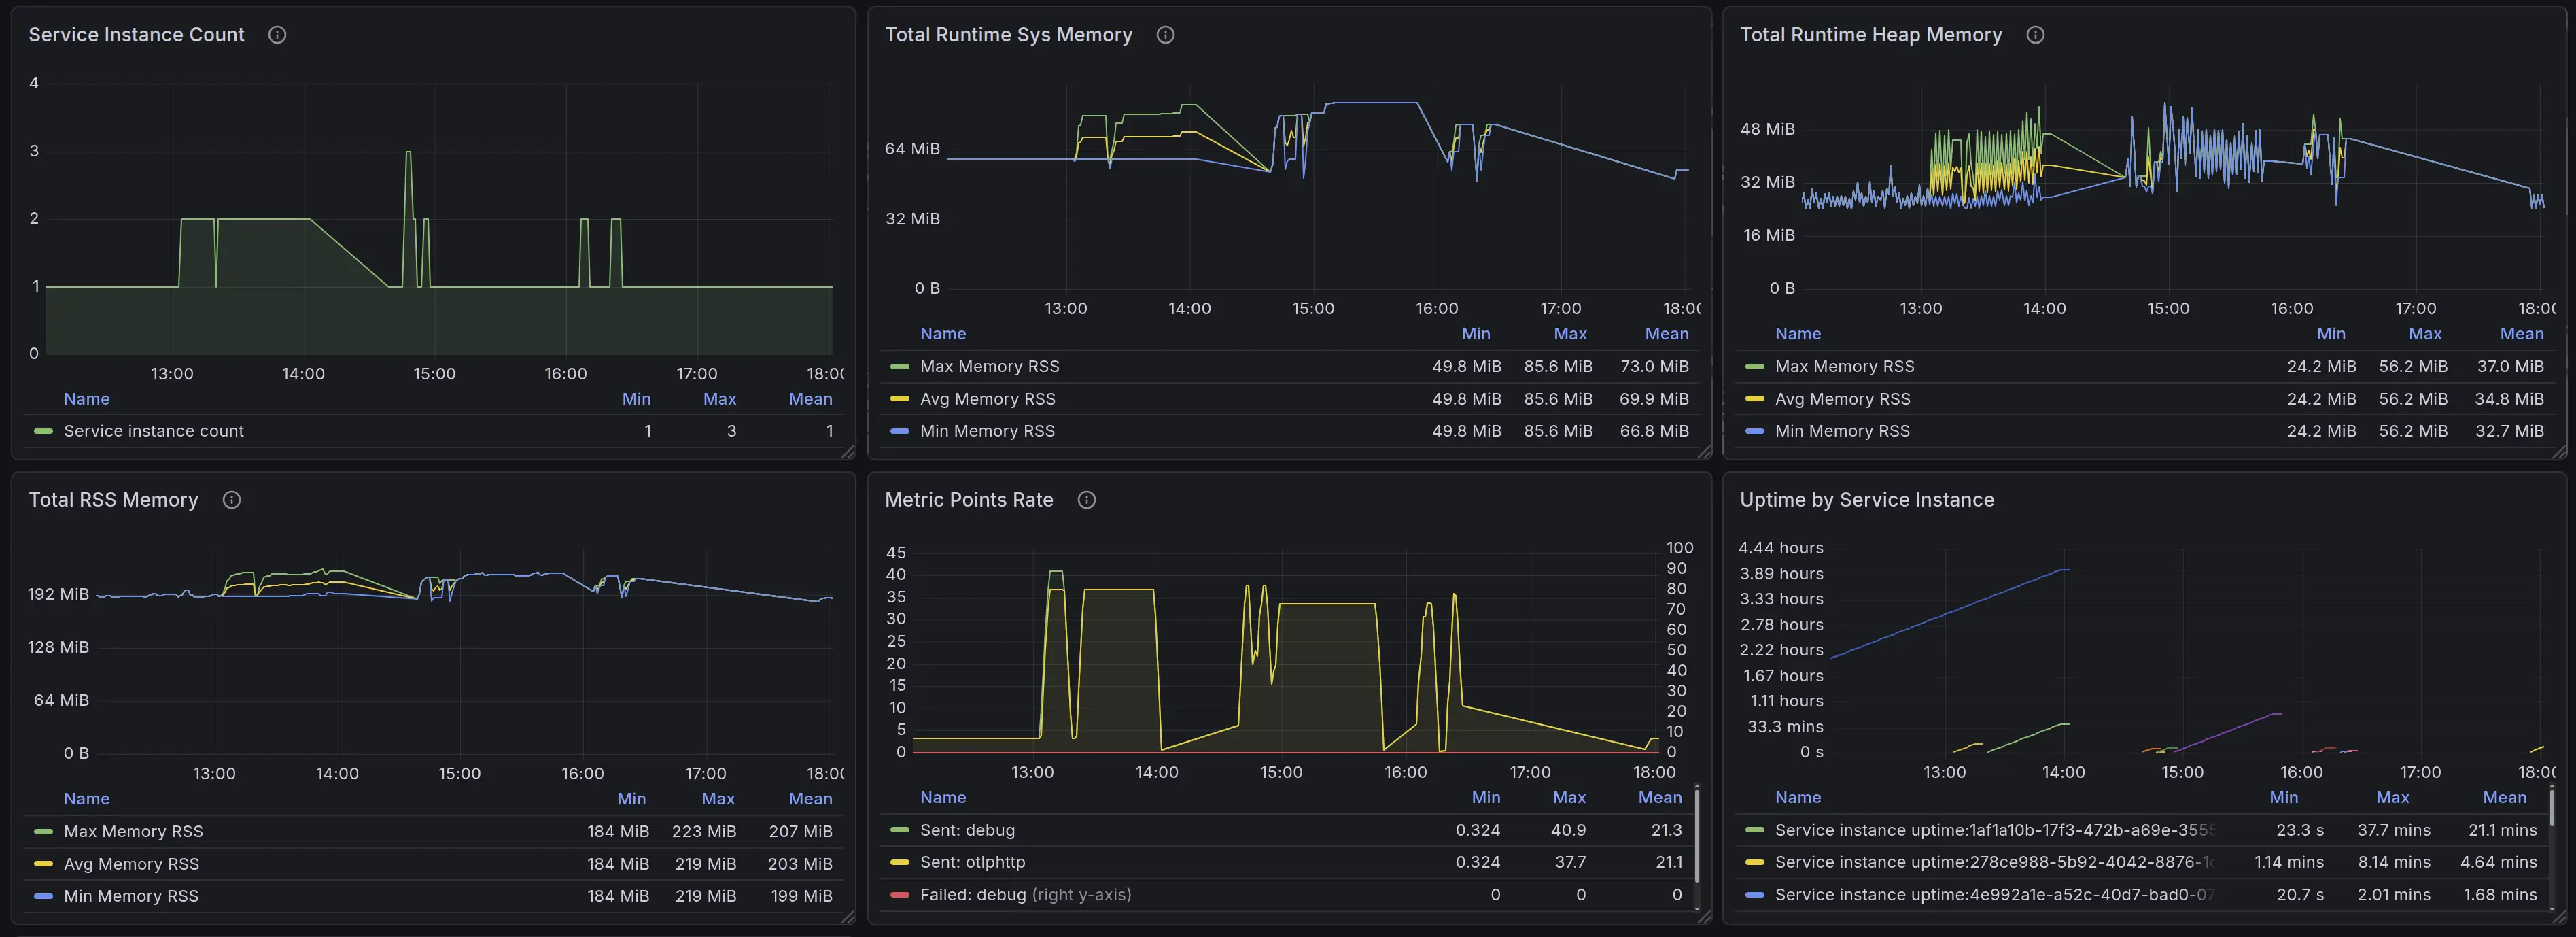
You can create dashboards to visualize service performance:
rate(zato_service_demo_ping_total[1m]) to show requests per secondThis lets you track request rates, spot traffic patterns, and identify load trends across your API platform.
Use self.metrics.push to send custom metrics from your services to Grafana Cloud. This lets you track business-level indicators alongside system metrics.
Your services have access to two metrics methods:
self.metrics.push(name, value) - Sets a gauge metric to a specific value. Use this for values that can go up or down, like queue depths, temperatures, or percentages.
self.metrics.incr(name, value=1) - Increments a counter metric. Use this for values that only increase, like total requests processed or errors encountered.
# -*- coding: utf-8 -*-

from zato.server.service import Service

class FlightBoardingStatus(Service):

    def handle(self):

        # Get boarding data from the request
        passengers_boarded = self.request.payload['passengers_boarded']
        passengers_total = self.request.payload['passengers_total']

        # Calculate boarding percentage
        boarding_percentage = (passengers_boarded / passengers_total) * 100

        # Push metrics to Grafana Cloud
        self.metrics.push('airport.flight.passengers_boarded', passengers_boarded)
        self.metrics.push('airport.flight.boarding_percentage', boarding_percentage)

        # Continue with business logic
        self.response.payload = {'status': 'ok', 'boarding_percentage': boarding_percentage}
After pushing metrics from your service, follow these steps to locate them:
https://example.grafana.net)airport_flight_passengers_boardedRemember that dots in metric names are automatically converted to underscores by Grafana. So airport.flight.passengers_boarded becomes airport_flight_passengers_boarded.
To create a dashboard that displays your custom metrics:
airport_flight_boarding_percentageEvery metric pushed through self.metrics.push or self.metrics.incr includes a service label with the name of the service that sent it. This lets you filter metrics by service.
For example, if you have multiple services pushing the same metric name:
You can build metrics fpr any domain where you need to track business or operational metrics in real-time.
For instance:
In cybersecurity, services processing events from SIEM systems can push metrics for failed authentication attempts, high-severity incidents, current threat levels, and blocked IP counts - letting security teams build dashboards that show attack patterns and response effectiveness.
In telecommunications, services receiving data from network equipment can push metrics for active calls per switch, signal strength, dropped call counts, bandwidth utilization, and SMS queue depths - giving network operations teams visibility into capacity, quality degradation, and congestion patterns.
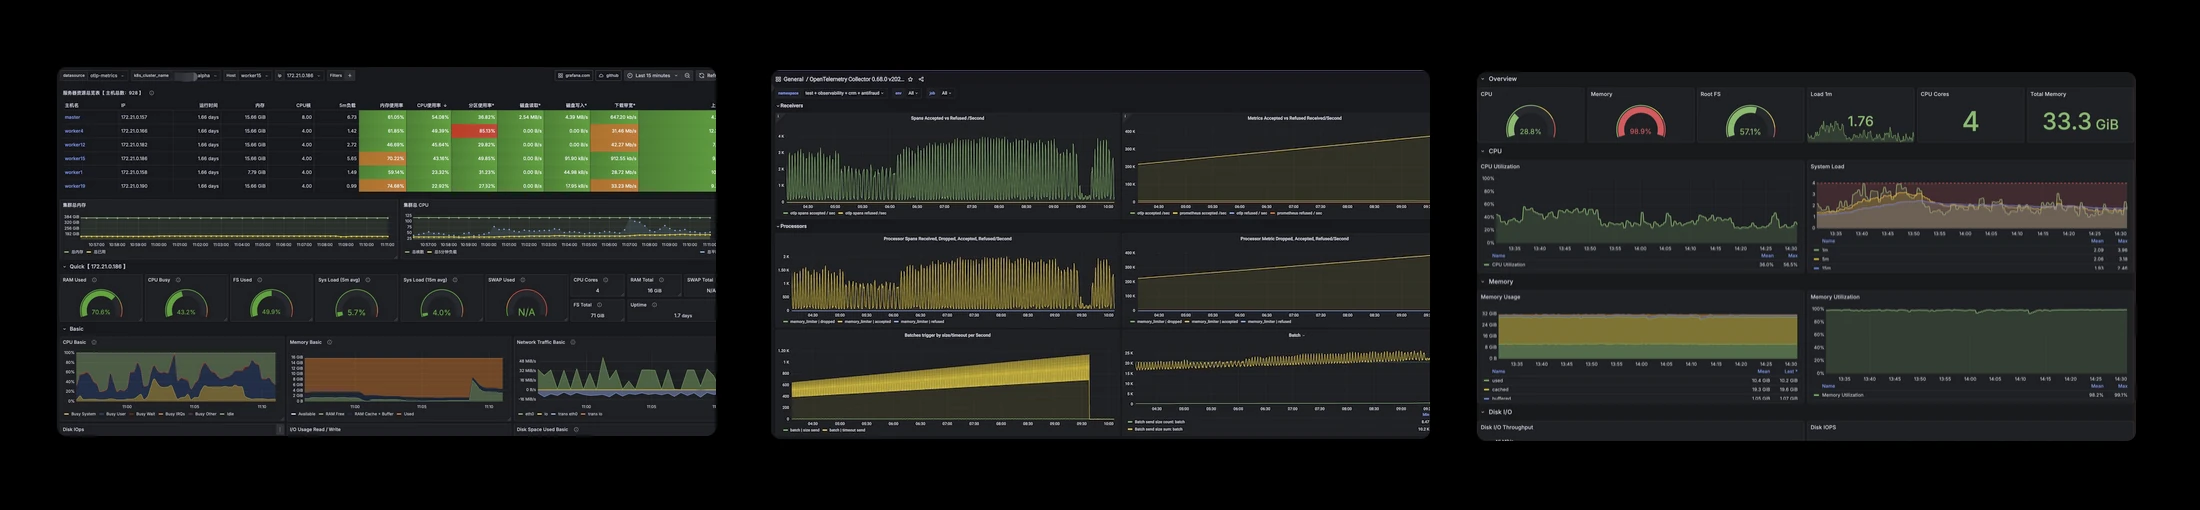
Since Zato exports metrics using OpenTelemetry Protocol (OTLP), you can use any OTLP-compatible dashboard template from the Grafana community. This gives you access to hundreds of various existing dashboards without additional configuration.
To import a dashboard:
These community dashboards work with Zato's OTLP metrics:
OpenTelemetry Host Metrics (ID: 20376) - CPU, memory, disk, network, and filesystem metrics adapted from Node Exporter format. Good starting point for container monitoring.
OTEL Host Metrics (ID: 23319) - Alternative host metrics dashboard with a different layout.
OpenTelemetry Collector (ID: 15983) - Monitors the telemetry pipeline itself, useful for debugging metric delivery issues.
To automatically configure Grafana Cloud when your container starts, using environment variables, as below:
docker run -it \
  -e Zato_Grafana_Cloud_Instance_ID=123456 \
  -e Zato_Grafana_Cloud_API_Key=your-api-key-here \
  -e Zato_Grafana_Cloud_Endpoint=https://otlp-gateway-prod-us-central-0.grafana.net/otlp \
  zatosource/zato-4.1
Environment variables take precedence over dashboard configuration. This is useful for: